
01
How to Start with Trading: A Beginner's Guide
How to Start with Trading: A Beginner's Guide
Before we dive into some specific aspects of trading, it’s important to remember that the field is vast, and while we will cover some crucial points, continuous education and adapting your strategies are essential for long-term success. Here are a few key things you should know:
What is Trading?
Trading, also known as dealing, involves the buying and selling of financial instruments with the aim of making a profit from short-term price movements. This type of activity can involve a wide range of assets, including stocks, bonds, commodities, currency pairs (forex), and other derivatives.
What is Traded?
Many types of assets are traded on financial markets. Some of the most popular include:
- Stocks - shares of ownership in companies that are publicly traded on exchanges.
- Bonds - investment tools used by governments or corporations to raise capital through debt.
- Commodities - basic goods such as gold, oil, or agricultural products that are traded on commodity exchanges.
- Forex - currency trading, where investors speculate on movements between different currency pairs.
- Cryptocurrencies - digital or virtual currencies that use cryptography for security, traded on various platforms and exchanges.
The Difference Between CFDs and Investing
CFDs (Contracts for Difference) are financial derivatives that allow speculators to bet on price changes of assets without actually owning the asset. CFD traders can profit from both rising and falling markets.
Conversely, investing typically involves holding assets long-term with the expectation that their value will grow over time. This differs from trading, which is more focused on short-term opportunities.
Calculating Leverage
Leverage is a technique that allows traders to "amplify" the value of their trade. This means they can open larger positions with a smaller amount of their own capital. Leverage is expressed as a ratio, such as 10:1, which means that for every dollar invested, you can trade as if you had ten dollars.
Example of Leverage Calculation:
Suppose a trader wants to buy 100 shares of a company, and the price per share is $50. Normally, buying these shares outright would require $5,000. However, using a 10:1 leverage, the trader only needs to invest $500 of their own capital. Here’s the calculation:
- Total value of shares: 100 shares x $50/share = $5,000
- Leverage ratio: 10:1
- Trader's own investment: Total value of shares / Leverage ratio = $5,000 / 10 = $500
With $500, the trader controls 100 shares valued at $5,000, significantly increasing the potential for higher profits. However, it's important to remember that while leverage can increase potential returns, it also increases potential risks, as losses are also amplified.
What is a Margin Call?
A margin call occurs when the value of an investor’s margin account falls below the broker’s required amount. A margin account is used by traders to borrow money from a broker to purchase securities, which involves leverage. If the market moves against the trader’s position, they may be required to deposit additional funds to maintain their position. If they fail to meet the margin requirements, the broker has the right to sell securities to bring the account back up to the required level.
- Example of a Margin Call:
Suppose a trader uses $1,000 of their own money and borrows $9,000 from their broker to purchase $10,000 worth of stock (using 10:1 leverage). If the stock value drops by 10%, the total value of the stock becomes $9,000. Since this is equal to the amount borrowed, the equity (difference between the stock’s current value and the loan amount) becomes zero. The broker may then issue a margin call, requiring the trader to deposit more funds to cover the loss and maintain the margin.
Risk Management in Trading
Effective risk management is crucial for successful trading. Traders should always consider potential losses before potential gains and set up their trades to limit the risk of capital loss. This usually includes setting stop-loss orders that automatically close the trade at a certain loss threshold and managing the size of positions to avoid overexposure to a single trade.
What is Technical Analysis?
Technical analysis is a method used by traders to evaluate investments and identify trading opportunities by analyzing statistical trends gathered from trading activity, such as price movement and volume. Unlike fundamental analysis, which attempts to evaluate a security's value based on business results such as sales and earnings, technical analysis focuses on the study of price and volume. Technical analysts use charts and various tools to identify patterns that can suggest future activity.One popular platform for technical analysis is TradingView, which provides comprehensive tools and charts for a variety of financial instruments. Basic concepts commonly used in technical analysis include:
• Fibonacci Retracement - a tool used to identify potential reversal levels. These are horizontal lines that indicate where support and resistance are likely to occur, based on Fibonacci numbers.
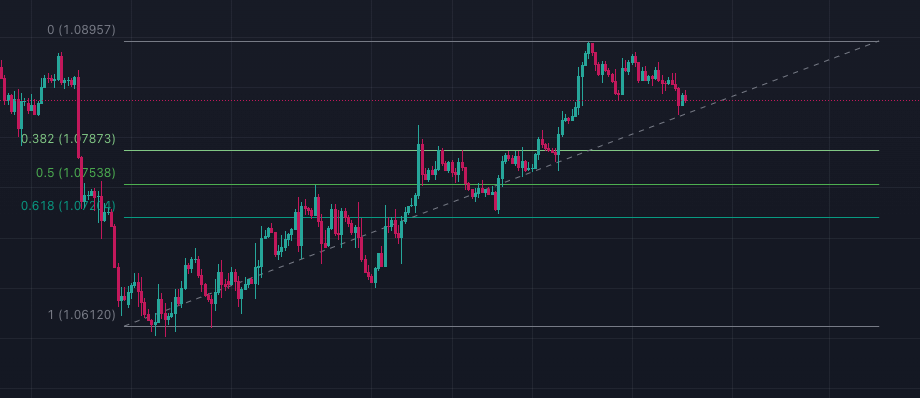
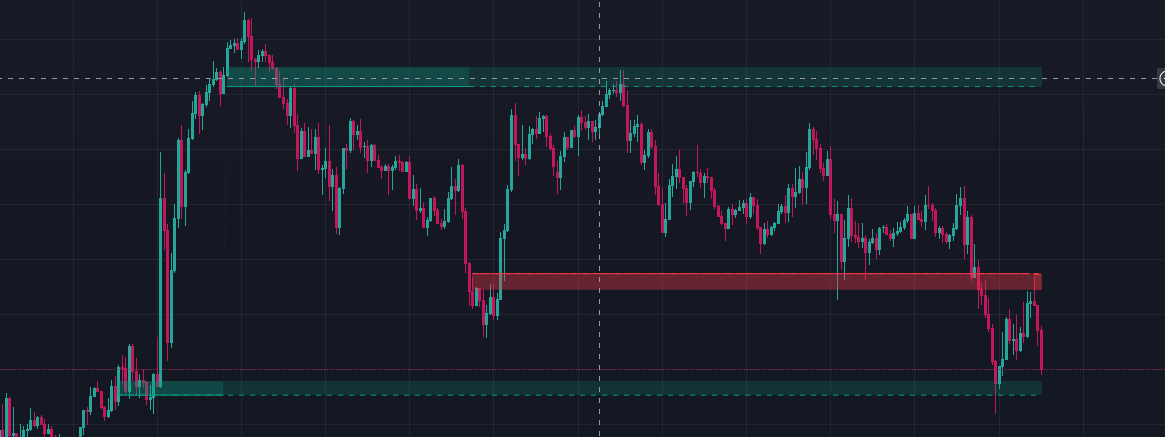
• Support and Resistance Levels - key concepts where the price of an asset tends to find resistance as it rises (preventing the price from being pushed higher) or support as it falls (preventing the price from falling further). These levels can guide traders on potential entry and exit points.
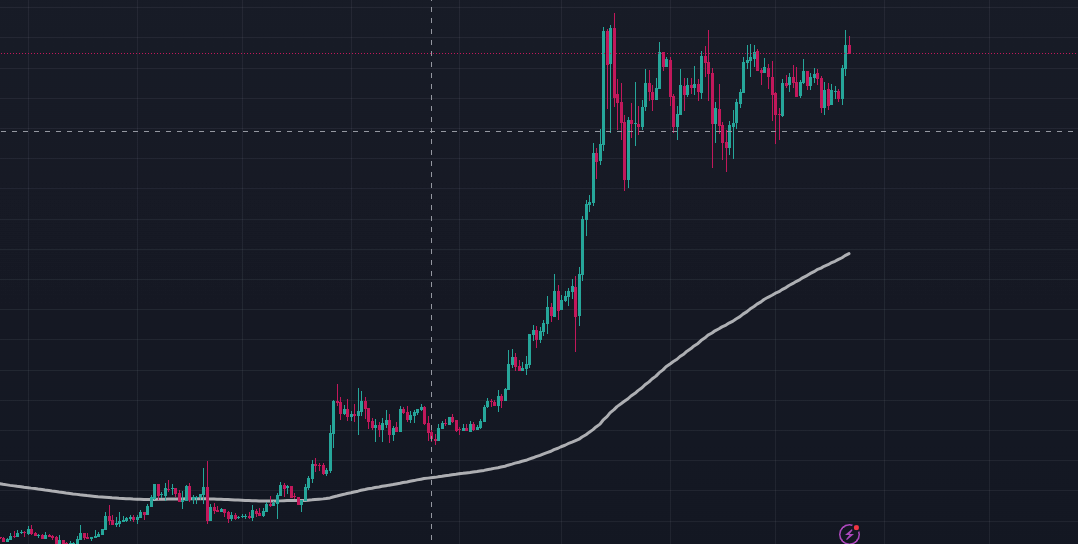
• Exponential Moving Average (EMA) - Exponential Moving Average (EMA) - This is a type of moving average that places a greater weight and significance on the most recent data points, commonly used to smooth out price data to identify trends more clearly. For example, the 200 EMA is often used to determine the market trend: if the price is above the 200 EMA, it indicates an uptrend, whereas if the price is below the 200 EMA, it indicates a downtrend.
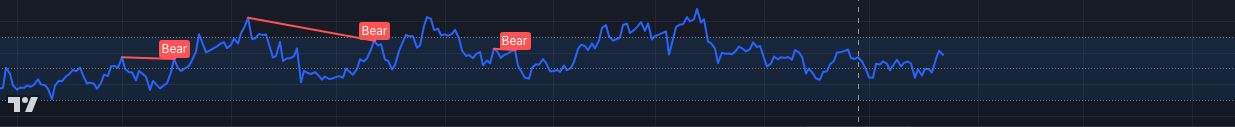
• Relative Strength Index (RSI) - An oscillator that measures the speed and change of price movements, with values ranging from 0 to 100. It is typically used to identify overbought or oversold conditions, offering signals that help predict the future direction of market prices.
It is crucial to note that these tools and concepts are just examples of what can be used in technical analysis. No single method or tool is sufficient for achieving trading success. Effective trading strategies often involve a combination of several different techniques and continual learning to adapt to changing market conditions. This highlights the necessity for traders to be well-versed in a variety of analytical tools, enabling them to enhance their decision-making process and improve their trading outcomes.
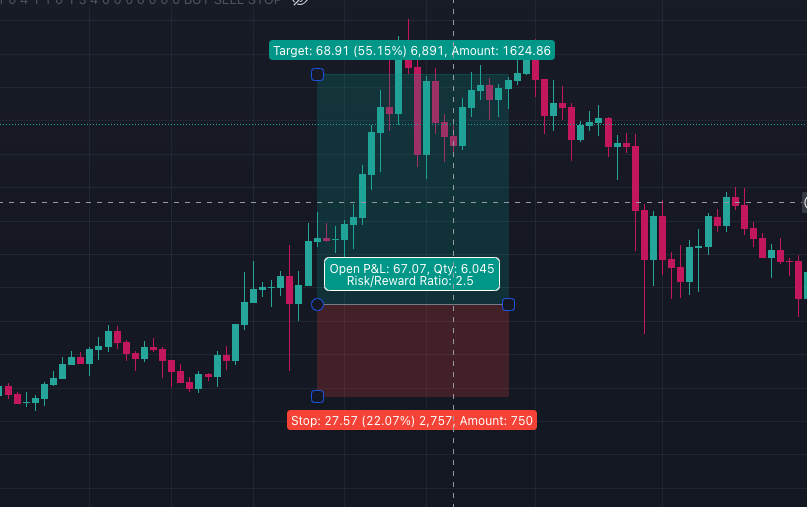
Understanding Risk-Reward Ratio
A crucial aspect of successful trading is understanding the risk-reward ratio. This ratio compares the potential profit of a trade to the potential loss, helping traders assess whether a trade is worth pursuing. For example, a risk-reward ratio of 1:3 means that for every dollar you're willing to risk, the potential reward is three dollars. By consistently maintaining a favorable risk-reward ratio, traders can remain profitable even if only a fraction of their trades succeed.
When developing your trading strategy, consider aiming for a ratio that aligns with your goals and risk tolerance. A commonly recommended risk-reward ratio is 1:3, as it provides a good balance between profitability and managing risk exposure. However, the ideal ratio may vary based on market conditions and your individual trading style.
Furthermore, effective risk management also involves determining the appropriate position size and setting stop-loss levels. By calculating these factors carefully, you can protect your capital while optimizing potential gains.
Developing Your Own Trading Strategy
Every trader should have a clearly defined trading strategy that matches their investment goals, time horizon, and risk tolerance. The strategy can be simple, such as trading based on technical analysis, or complex, involving various analytical methods and algorithms. It is important that the strategy is regularly reviewed and adjusted to current market conditions.
Trade Only What You Can Afford to Lose
It’s crucial to remember that trading involves significant risks, and it’s possible to lose money as well as make it. Therefore, always follow the golden rule of trading: only invest money that you can afford to lose. This will help you make more rational decisions and keep your financial stability intact even if the markets move against you.